 World Liner Supply Analytics
 |
|
ComPair Data saves historical capacity data
on all services on a weekly basis going back at least one year and
monthly data going back to March 2009 and quarterly data to January 2008
in our live database. Historical data before January 2008 is available
on request.
Users can quest the live database and then
use ComPair Data's Excel based pivot tables to run various metrics on
the data. The resulting query tables and pivot tables are left open to
allow users to create their own views of the data.
Currently there are two queries and reports
available to users, the service and capacity queries and reports, and
the transit time queries and reports. Show below are samples of some of
the metrics available to users. |
Allocated capacity for Asia to Europe
|
Period |
Assigned Vessel TEU Capacity |
Weekly Allocated Capacity |
Annual Allocated Capacity |
Change in Weekly Capacity |
Change in Annual Capacity |
% Change |
|
3-Jan-10 |
3,074,843 |
291,210 |
15,184,563 |
|
|
|
|
7-Feb-10 |
3,034,180 |
286,695 |
14,949,137 |
-4515 |
-235,426 |
-1.55% |
|
7-Mar-10 |
3,107,553 |
294,722 |
15,367,689 |
8027 |
418,552 |
2.80% |
|
4-Apr-10 |
3,360,129 |
318,024 |
16,582,725 |
23302 |
1,215,036 |
7.91% |
|
2-May-10 |
3,529,564 |
328,495 |
17,128,715 |
10471 |
545,989 |
3.29% |
|
6-Jun-10 |
3,612,592 |
326,853 |
17,043,096 |
-1642 |
-85,619 |
-0.50% |
|
4-Jul-10 |
3,719,594 |
338,707 |
17,661,199 |
11854 |
618,103 |
3.63% |
|
1-Aug-10 |
3,759,308 |
346,832 |
18,084,861 |
8125 |
423,662 |
2.40% |
|
5-Sep-10 |
3,796,020 |
351,553 |
18,331,028 |
4721 |
246,167 |
1.36% |
|
3-Oct-10 |
3,895,653 |
355,595 |
18,541,790 |
4042 |
210,762 |
1.15% |
|
17-Oct-10 |
3,863,555 |
341,294 |
17,796,093 |
-14301 |
-745,697 |
-4.02% |
|
|
Service Detail
|
Service |
Data |
3-Jan-10 |
4-Apr-10 |
4-Jul-10 |
1-Aug-10 |
5-Sep-10 |
3-Oct-10 |
17-Oct-10 |
|
CMA CGM/ANL - MEX |
# Vessels |
10 |
11 |
11 |
11 |
11 |
11 |
11 |
|
|
Ratio Deployed to Allocated Capacity |
12.125 |
10.988 |
14.338 |
14.642 |
10.991 |
10.991 |
10.991 |
|
|
Frequency (days) |
7 |
7 |
7 |
7 |
7 |
7 |
7 |
|
|
Nominal Weekly TEU |
5,596 |
5,646 |
5,786 |
5,786 |
6,024 |
6,003 |
6,003 |
|
|
Trade Route Allocation |
82.39% |
100.00% |
76.63% |
75.03% |
100.00% |
100.00% |
100.00% |
|
|
Vessel Capacity for Service |
55,958 |
62,105 |
63,648 |
63,648 |
66,263 |
66,035 |
66,035 |
|
|
Weekly Allocated Cap. |
4,615 |
5,652 |
4,439 |
4,347 |
6,029 |
6,008 |
6,008 |
|
|
Annual Allocated Cap. |
240,640 |
294,712 |
231,463 |
226,666 |
314,370 |
313,275 |
313,275 |
|
|
Monthly Allocated Cap. |
20,108 |
24,626 |
19,341 |
18,940 |
26,268 |
26,177 |
26,177 |
|
|
Change in Annual Capacity |
|
54,072 |
-63,249 |
-4,797 |
87,705 |
-1,095 |
0 |
|
|
Change in Weekly Capacity |
|
1037 |
-1213 |
-92 |
1682 |
-21 |
0 |
|
|
% Change |
|
22.47% |
-21.46% |
-2.07% |
38.69% |
-0.35% |
0.00% |
|
|
Carrier Group Detail
|
Carrier Group |
Data |
3-Jan-10 |
7-Feb-10 |
4-Apr-10 |
4-Jul-10 |
1-Aug-10 |
5-Sep-10 |
3-Oct-10 |
17-Oct-10 |
|
CMA CGM |
# Vessels |
58 |
61 |
61 |
61 |
62 |
63 |
64 |
64 |
| |
Ratio Deployed to Allocated Capacity |
10.211 |
11.011 |
10.689 |
11.234 |
11.053 |
10.631 |
10.857 |
10.863 |
|
|
Nominal TEU Cap. |
405,501 |
423,342 |
423,126 |
462,110 |
467,254 |
478,401 |
499,529 |
499,529 |
|
|
Annual Allocated Cap. |
2,070,703 |
2,004,742 |
2,064,133 |
2,144,902 |
2,204,345 |
2,346,487 |
2,399,047 |
2,397,744 |
|
|
Monthly Allocated Capacity |
173,025 |
167,514 |
172,476 |
179,225 |
184,192 |
196,069 |
200,461 |
200,352 |
|
|
Weekly Allocated Cap. |
39,712 |
38,447 |
39,586 |
41,135 |
42,275 |
45,001 |
46,009 |
45,984 |
|
|
Change in Annual Capacity |
|
-65,961 |
59,391 |
80,770 |
59,443 |
142,142 |
52,560 |
-1,304 |
|
|
Change in Weekly Capacity |
|
-1265 |
1139 |
1549 |
1140 |
2726 |
1008 |
-25 |
|
|
% Change |
|
-3.19% |
2.96% |
3.91% |
2.77% |
6.45% |
2.24% |
-0.05% |
|
|
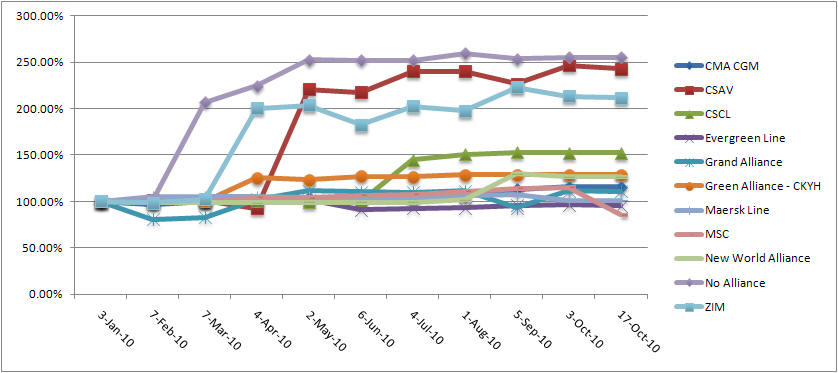
Changes in Carrier Group Capacity Over Tme
 |
|
Allocated Capacity by Vessel Operator
|
Weekly Allocated Capacity |
Period |
|
|
|
|
|
|
|
|
|
|
|
|
Operator |
3-Jan-10 |
7-Feb-10 |
7-Mar-10 |
4-Apr-10 |
2-May-10 |
6-Jun-10 |
4-Jul-10 |
1-Aug-10 |
5-Sep-10 |
3-Oct-10 |
17-Oct-10 |
|
|
Maersk Line |
60,420 |
63,401 |
63,281 |
63,073 |
61,412 |
60,756 |
66,286 |
68,272 |
68,734 |
65,187 |
64,871 |
|
|
MSC-Mediterranean Shipping Co. |
45,173 |
45,187 |
44,895 |
47,153 |
47,063 |
48,147 |
48,659 |
50,228 |
51,549 |
52,144 |
38,581 |
|
|
CMA CGM |
36,065 |
35,364 |
36,384 |
35,962 |
36,827 |
35,879 |
39,931 |
38,819 |
41,823 |
42,802 |
42,808 |
|
|
CSCL-China Shipping Container Lines |
17,352 |
17,451 |
16,613 |
16,613 |
16,508 |
17,074 |
17,661 |
19,628 |
20,584 |
20,453 |
19,750 |
|
|
Hanjin Shipping |
12,935 |
13,064 |
13,064 |
23,875 |
20,345 |
18,416 |
18,915 |
19,943 |
19,559 |
19,565 |
19,576 |
|
|
COSCO |
15,183 |
15,183 |
15,183 |
16,336 |
17,818 |
19,057 |
18,228 |
18,225 |
18,225 |
18,225 |
18,225 |
|
|
Evergreen Line |
14,041 |
14,232 |
14,171 |
14,544 |
15,348 |
13,687 |
13,879 |
13,945 |
12,138 |
12,237 |
12,115 |
|
|
Hapag-Lloyd |
12,489 |
8,113 |
8,788 |
9,530 |
12,987 |
13,525 |
13,289 |
14,413 |
13,664 |
15,632 |
15,436 |
|
|
Yang Ming |
10,934 |
10,875 |
10,934 |
10,136 |
10,136 |
12,126 |
12,083 |
12,081 |
12,207 |
12,222 |
12,232 |
|
|
OOCL |
10,231 |
8,716 |
8,751 |
11,276 |
10,524 |
10,409 |
10,993 |
11,003 |
10,948 |
11,096 |
11,096 |
|
|
|
Capacity Management Asia to Europe
 |
| Download a sample World Liner Supply
Analytics:
Capacity Report |
|
