Home

Reports

Products

Request Demo

Contact Us

BlueWater Reporting

Individual Login


  Liner Shipping Research

ComPair Data researchers track rotation, transit and capacity data on the liner services operated by 200 ocean carriers on 112 trade routes making ComPair Data the most comprehensive database of liner shipping available today.

Data integrity is critical to you and is critical to us. All data entered is double checked by a second researcher before being entered and then verified by the researcher director and database editor after being entered.


  Analytic Tools

ComPair Data allows you to query the data directly and provides sophisticated tools that allow you to compare and analyze liner shipping metrics the way you want to see them.

  Taming Cyclical Rates

Have ocean carriers found the key to reining in the boom-and-bust rate cycle ?

The latest special report from ComPair Data explores the tools that carriers deployed to manage capacity going into the 2010 rate negotiations and the spectacular results they achieved.

Purchase this 44 page analysis prepared by ComPair Data and American Shipper by clicking the report.

  Schedule Integration

In addition to providing detailed data for analysis of liner shipping, ComPair Data also gathers detailed vessel voyage schedule information on liner services on a global basis.

ComPair takes a unique approach in gathering schedule data. When we launch a trade route, we cover 100% of the liner services available on that trade route.

Schedules are provided in a data format designed to be easily integrated with  contract and allocation data enabling companies to more effectively manage and control the procurement of ocean carriers services.

Click here to request a demonstration.

  Data Snapshot


Ocean liner operators have deployed different strategies in 2010 to bring available capacity into better balance with demand in their efforts to return ocean shipping rates to profitable levels. At a time when large amounts of new tonnage was coming on line, carriers suspended some services while implementing slow 
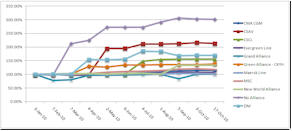
steaming strategies on other services. By tracking the ratio of deployed TEU capacity, (the capacity of all container ships operating in a trade,) with the Allocated capacity (capacity actually available to shippers,) you can see how carriers are managing capacity by reducing the available capacity against deployed capacity.

Going into 2010, carriers began to employ slow steaming strategies that not only generated substantial fuel saving for the carriers but also restricted the growth in capacity. As cargo peaked in the summer and demand exceed capacity - and rates went up - carriers eased capacity restraints by ending slow steaming on some services. Between June and September the ratio of deployed to allocated capacity decreased. Between September and October, however, as demand slacked off, carriers began to reintroduce slow steaming strategies and the ratio again began to move up.

This chart is one of several analytical views that are available in the latest build of the ComPair Data's World Liners Supply Analytics released October 26.

  Corporate Portal

ComPair's Corporate Information Portal is the one stop information page including ServiceTracker and links to current industry news from our news partner, American Shipper.

ServiceTracker is a live feed from the ComPair Data research team tracking changes in ocean carrier liner services as they are made to the database.

The Corporate Information Portal also offers direct links to queries, World Liner Supply Analytics' tools, reports and other resources available to corporate licensees of ComPair.